How Sensible Adds Observability, Telemetry, and Tracing to Our System
Loren Brindze breaks down Sensible's quest for greater observability in our system.
By Loren Brindze
June 3, 2022
At Sensible, we prioritize observability in our software. We aim to provide stable, minimally-invasive tooling and better data for our engineers.
To do this, we built our MVP with instrumentation using the OpenTelemetry standards and associated tooling. This has already provided a return on investment, allowing us to more rapidly diagnose and remedy bugs, and identify performance issues within our services.
As a whole, instrumented code has given us the tools to improve the reliability and performance of our codebase. Below are possible next steps for a unified telemetry system that combines logging, metrics, and distributed tracing.
Pillars of Observability
Knowing what is going on inside your software is tantamount to operating a highly available service.
Our team wanted to be able to answer questions like:
- “Why is this bug happening?”
- “What service is causing this particular request to take so long?”
- “How much RAM/CPU is my service using”?
- “Where in my code is this request failing?”
Telemetry is necessary to find (or even know to look for) logs, and to make sense of how they are connected to the rest of the system, especially in a distributed context.
As such, we needed a way to:
- Aggregate logs and search them;
- Expose runtime operating metrics of deployed services;
- Run targeted distributed traces to diagnose long-tail latencies and other service dependency bugs.
Infrastructure
At Sensible, we use OpenTelemetry as a way of tying together observability requirements into a single system.
OpenTelemetry is a project incubated by the Cloud Native Computing Foundation, which aims to unify the disparate telemetry APIs and standards into a single set of adapters to work across systems. As there are many competing and overlapping standards in this space, OpenTelemetry is a unified effort to combine these and support the primary use-cases we outlined above.
On a high level, the major pieces of infrastructure we added are:
- Instrumented Applications: uses the OpenTelemetry protocol to send telemetry to the Collectors
- The OpenTelemetry Collector agent: which is installed as a sidecar
- Prometheus: for scraping and storing metrics from the collectors.
- Jaeger: for providing a backend to view and query collected distributed traces
- Elasticsearch: as a receptacle for log data using
- Kibana and Grafana: as a UI/visualization tool to help find correlations between metrics, logs, events etc.
Instrumented Applications
We start with an instrumented application, which can be done by applying the OpenTelemetry, SDKs, and APIs to the code. We can do this through direct instrumentation of spans, manually adding in code that defines these components—or through automatic instrumentation.
Automatic instrumentation relies on tools that inject instrumented versions of our common libraries into the code, to provide context aware traces and observability with minimal changes to the application stack. The latter portion is best suited for dynamic languages, where this kind of library injection is easily possible.
Below, I’ll focus on these efforts as they relate to python and JavaScript within Sensible’s stack, and how we use both semi-automatic and manual methods to cover the compiled Golang code.
For convenience, the OpenTelemetry Operator for Kubernetes comes with some really nice CRDs that were used to auto instrument python and JavaScript code. This means for the most basic cases, all we need to do is add a configuration file and annotation to our existing Kubernetes deployment resources to describe the instrumentation configurations we would like to apply, e.g.
This configures an instrumentation context and runs auto-instrumentation on application deployments that are configured with the following annotation
The goal of this auto-instrumentation step is to provide an easy pipeline of tracing and metric data to the OpenTelemetry collectors, so they can distribute telemetry data to the correct backend (traces→Jaeger, logs→Elasticsearch, metrics→Prometheus).
Auto instrumentation (where possible) allows us to quickly adopt the complete telemetry toolkits and get value instantly. Once you have the working telemetry stack in place, you can then use it to further optimize the telemetry data you want to know about by applying more advanced manual instrumentation where needed.
Manual Instrumentation
Auto-instrumentation is only half the story—and isn’t available as an easy option for Golang due to the nature of compiled languages. And within Python, instrumenting some of our concurrent code (async) automatically presented race conditions that caused the Celery workers to crash.
To get more insight into these parts of our system, we needed to manually add traces and propagators to our code base, as documented here for Golang and Python.
Here’s a list of available Golang instrumented libraries: https://opentelemetry.io/registry/?language=go&component=instrumentation
Collectors
Our MVP uses OpenTelemetry to collect all metrics, logs, and traces, and then offloads this telemetry data to a ‘collector’ agent. The collector can do some simple post-processing on the telemetry data (such as injecting an environment tag to designate which environment the span came from) and distribute data to its appropriate backend.
To accomplish this, we installed the OpenTelemetry Operator to manage the lifecycle of the collector processes, along with the auto instrumentation features referenced above. To add a collector to your application deployment, you need to configure an OpenTelemetry Collector CRD in your manifest, then let the installed operator manage the lifecycle of your collector.
Collectors can be deployed in a number of configurations. These include having one collector per Kubernetes worker node (daemonset), having a pool of collectors per namespace (deployment), or having a colocated process that runs alongside each application container within the same pod (sidecar).
Since the collector process is generally lightweight, and often configured alongside the application, we opted to use the sidecar configuration which is automatically managed by the linked configurations. This means, to send metrics from your application to the collector, you simply access it over the right port (usually 4317 or 4318 depending on the protocol used) on 127.0.0.1 since this is collocated in the same pod as the application deployment.
You can also explore other configurations for the collectors, but in our current view, the sidecar approach offers the best compromise between maintainability and performance without negatively affecting the running application. In many cases, there may be inefficiencies to deploying the same process to your infrastructure. The tradeoff for our system is that we have a much easier architecture and service topology. It also means in the case of failures, we only lose a single service’s telemetry data instead of the entire namespace or cluster.
Documentation on specific configuration options and use cases for the OpenTelemetry Operator can be found here: https://github.com/open-telemetry/opentelemetry-operator
Tracing Backend
The tracing backend provided by this MVP is Jaeger—although thanks to the flexibility of OpenTelemetry, we can easily swap this out for Zipkin or OpenCensus if those systems are preferred.
The choice to use Jaeger at this point in time is motivated by the fact it has the largest community adoption and support, along with the most modern and stable set of features based on the alternatives surveyed. It's open to discussion for us as a team. If we have a good reason to use another tracing backend, we'll have the right scaffolding in place to make this transition completely transparent to the application engineer.
In order to make it easier to onboard this new observability stack, we opted to first get everything online using the single container package called “Jaeger-all-in-one”.
Before scaling up our tracing efforts (but after completing basic tracing coverage/instrumentation across all our services) we will need to upgrade our Jaeger deployment to a multi container build. This will be through the Jaeger Kubernetes operator—or through a more manually managed helm deployment, where we pick and choose which Jaeger subcomponents we actually want to deploy.
For a more in depth look at what these components are, see: https://www.jaegertracing.io/docs/1.31/architecture/
The tracing backend does not persist data beyond memory. Thus, it will require an upgrade as soon as you need persistence, or need to hold more traces than can reasonably fit in the memory of the Jaeger-all-in-one process.
To access the tracing UI, configure your kubectl to point to the dev cluster, and then run:
kubectl port-forward -n tools jaeger-all-in-one-0 16686
Next, navigate in your browser to: [<http://localhost:16686>](
Make a request to an instrumented service and see the results when you search for your recent request in the UI.
Metrics and Logging
At this point in time, the MVP has set up basic infrastructure for OpenTelemetry, but has yet to pipe through metrics and logging.
Metrics overall are more stable in the OpenTelemetry project than log exports, but both are less stable than the tracing functionality outlined above. We should explore the feasibility of adding these in with the existing tools, and weight that against the trade-off of a separate, more stable system (such as Fluentd) for log exports.
Given the pace of adoption for OpenTelemetry, along with the large corporate and OSS support for this project, our team feels the risk of adopting a less stable technology is fairly low at this stage. However, we are not going to disable our existing metrics infrastructure until we are certain we are happy with what OpenTelemetry provides us in exchange.
Hosted Backends
There are a number of hosted backends that we can elect to use downstream of our collectors. Some of these options only target a single piece of managed observability infrastructure, while most others now offer a suite of observability tools.
Some options to consider in this space include:
Next Steps
Get excited about tracing and increased observability!

Sensible Weather Expands to New Destinations
Weather Guarantees are now available for hotels in France, Austria and the Caribbean

Sensible Weather Named a Condé Nast Traveler Bright Idea in Travel 2025
Sensible Weather named a Condé Nast Bright Idea for helping hotels offer Weather Guarantees, giving guests peace of mind when rain, snow, or high temperatures…
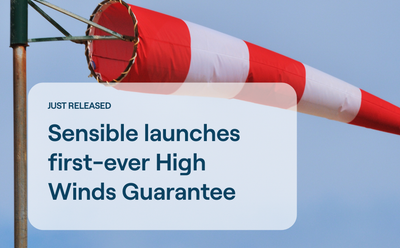
Sensible launches first-ever High Wind Guarantee
Sensible Weather Launches First-Ever High Wind Guarantee
Weather Guarantee ≠ Cancellation Insurance
How are our weather guarantees different from travel insurance or cancelation insurance?
Book a 15 minute overview
Find out how Weather Guarantees can support your revenue goals. No commitment. Just a quick overview.